
Welcome to the second post in a series exploring the evolution of the information security industry through the lens of RSA Conference sessions. The first one’s here if you missed it and need some background on what this is all about. Today I’m going to present sundry views into words that have made it to the “top” in some way or another. I put “top” in quotes here because not all these words will be at the top of their game. Some will, for instance, top the list of those who have lost their game and others are just starting to bring it. Game on.
What’s the frequency, Kenneth?

Figure 1. Box-and-whisker plot of overall word frequency across all session titles.
I’m not going to go all crazy with stats on this dataset, but a quick Box-and-Whisker plot of word usage frequencies might be helpful to those who know what you’re looking at. The median is 11, with 75% of words ranging between 5 and 21 uses. Words used more than 41 times are considered outliers, and there’s a bunch of them stretching all the way up to the max value of 182 sessions (“management”).
Whereas outliers are often ignored in statistical analyses, they’re actually quite relevant for our current purposes. Figure 2 shows the most common words used in all titles across all years - basically everything to the right of the rightmost whisker in Figure 1. It seems appropriate to me that “management” garnered more mentions than anything else. After all, the primary reason we meet as an industry to confer about all the other stuff listed in Figure 2 is to help us better manage security in our organizations[1].
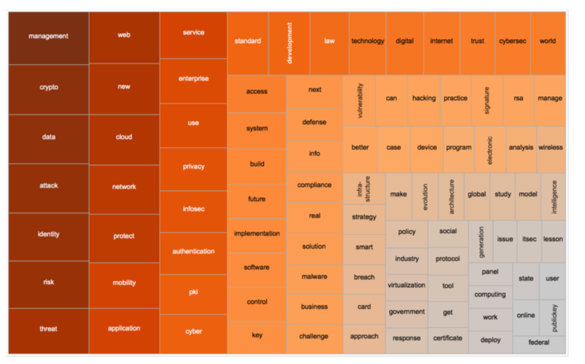
Figure 2. Treemap of "abnormally common" words (those identified as outliers in Figure 1).
I could make a lot of additional observations based on Figure 2, but overall frequencies aren’t something I want to dwell on. The values are heavily skewed in favor of more recent years due to the ever-rising session volume covered in the last post. Inspect it as much as you like, though; there are some interesting tidbits to be gleaned. In that same ‘show it and move on’ vein, I’ll toss in Figure 4 in case you’d like a closer look at the overall corpus of words we’re examining. Now moving on…

Figure 3. Words that didn't make Figure 3 (prominence=frequency).
Blowing it way out of proportion

Figure 4. Most frequently-used words with bars for percentage of sessions each year and lines for frequency.
Given the skewing effect of raw frequencies, word usage as a proportion of sessions each year might be a more meaningful way to achieve a more “apples-to-apples” comparison over time. To help us with that, the left column in Figure 4 lists the same words from Figure 2. It also presents a series of bars to the right corresponding to the percentage of sessions that word appeared in each year from 1992 (leftmost bar) to 2015 (rightmost bar). I excluded 1991 because taking a percentage of 2 sessions is silly. Finally, it overlays a line that tracks usage frequency over time.
This makes it easy to see that words like “crypto” and “pki,” once the main topic of conversation, are now mere whispers amid the buzz of more recent RSACs. We have to give those old-schoolers some props, though; nothing since has commandeered the conference Zeitgeist like that.
Noticeable as well are several slow-and-steady words like “enterprise,” “network,” “application,” and “law.” They never blow up, but they never fizzle out either. They seem to form the ongoing context within which we discuss more temporal trends.
Speaking of trendy topics, it’s fun to find stuff that’s so last week (like “web,” “service,” and “standard”) and stuff that’s currently on fleek (“threat,” “cloud,” and “cyber”).
Figure 4’s most important contribution, however, is that it once-and-for-all settles one of the industry’s most vigorous disputes. By the power invested in me by the RSAC Committee, I henceforth officially declare 2001 to be the “Year of PKI.” Oh – and there was a talk that year by the same name. Go figure.
Biggest losers and clearest winners
Playing off the ebbs and flows evident in Figure 4, I next wanted to determine which topics showed the steepest year-over-year decline and which ones boasted the opposite trend. Figure 5 calls out the biggest losers, while the clearest winners climb the medal stand. Losers and winners are differentiated by the slope of their 1992-2015 trend line.

Figure 5. Words trending up (% of annual sessions) / Words trending down (% of annual sessions).
Let’s address the elephant in the room first—“rsa” ranks #2 on the losers list. I feel obliged to remind you it’s a reference to the algorithm, not the company or the conference. We’ve already seen how RSAC has blossomed far beyond its cryptography roots, so the fact that “rsa” is a loser shouldn’t be a surprise. A tad ironic, yes, but not surprising.
Other than that, the two lists share many of the same words found in Figure 4, so I won’t subject you to the same quips all over again. One thing I do find quite interesting about Figure 5 and Figure 6 is the stark contrast they paint between what we were dealing with back then vs now. The security industry has no doubt evolved over the last quarter-century, and that’s been reflected by RSAC. I think Dylan offers sage advice here: Your old road is rapidly aging. Please get out of the new one if you can't lend your hand, for the times they are a changin’.
One more for the ages
Ok, ok. “Ages” is probably a stretch, but I couldn’t think of a catchy title with “era” or “period.” You’ll get over it; I did. Figure 6 lists the top 20 words for each five-year period of RSAC according to median percentage of annual sessions. The color intensity captures the relative proportion of words within each “age.” To really make it really busy, I added a slopegraph effect to help your eyes follow certain words rising and falling through the ages. I was hoping to uncover some key shifts by finding a happy medium between near-meaningless annual fluctuations and the flatness of a 25-year trend line.

Figure 6. Top 20 words per RSAC “age.”
The color intensity yields an interesting observation here. In the early days, the only words to show up in a high proportion of sessions was “crypto.” Everything else took a distant backseat. The expanding diversity and balance of the conference subject matter is clearly seen through the ’07-’11 era. Curiously, this reversed in recent years. My best explanation is that we began focusing on a narrower set of topics that scared/concerned us the most. Notice the top of the list in that era is a lot more threat-oriented than prior eras. I think that’s a rather important shift in our collective mindset. And I don’t think it’s random that words like “privacy” and “intelligence” start creeping up the list after them; we need ways to deal with those fears.
I also find it very interesting that no word is represented in all five columns. It seems to me that speaks to the topical churn in our industry. I’d like to say it’s because we solve old issues and move on to the next—and there’s probably an element of truth there. But I also have a suspicion that we’re simply captivated with the “new” (which, if you didn’t notice, makes the list in the last 3 ages). Only one word pulled off a four-peat—“management”—which conveniently puts us full circle back to where we started this post. I’ll take that as my exit cue.
In the next post, we’ll take a look at what RSAC sessions teach us about what security “management” means and how we go about it.
[1] Note: the data did not support my null hypothesis of “beer at the Thirsty Bear” or “drinks at the W” being the primary reason.